If you’ve ever built a pitch deck, you’ve almost certainly committed the TAM crime.
You found a market research report (Statista, Grand View Research, IBISWorld, take your pick), pulled out a headline figure like “the global CRM software market is projected to reach £62 billion by 2028,” dropped it into a slide, and called that your Total Addressable Market.
It isn’t. And experienced investors know it the moment they see it.
This isn’t a niche founder mistake. It’s almost universal. And it matters because an inflated or poorly constructed TAM doesn’t just mislead investors — it misleads you. It creates a false sense of opportunity that shapes hiring decisions, marketing spend, and strategic priorities. When reality eventually corrects it (usually between year 1 and year 2), the damage is already done.

Here’s how to tell whether your TAM holds up, and what to do if it doesn’t.
The Three Most Common TAM Mistakes
1. Confusing the industry with your market
This is the big one. The global market for project management software is enormous. But if you’re building a project management tool specifically for architecture firms in the UK, your TAM is not “global project management software.” Your TAM is the total spend on project management tooling by architecture firms. Which is a very different, much smaller number.
The industry report figure represents everyone who buys anything vaguely adjacent to what you sell. Your TAM should only include people who could plausibly and realistically buy your specific product or service. The moment you strip out the customers who would never buy from you (e.g wrong geography, wrong company size, wrong problem) your number usually drops dramatically.
That’s not bad news. A precisely defined, defensible TAM is far more useful than an inflated one.
2. Using top-down analysis without a bottom-up check
Top-down analysis (starting with an industry figure and applying percentage filters) is fast and feels rigorous. But it has a fundamental flaw: the percentages you apply are largely guesswork dressed up as arithmetic.
“The UK HR tech market is £4.2 billion. We’re targeting mid-market businesses, which represent roughly 30% of spend. So our SAM is £1.26 billion.” That 30% figure came from somewhere, but probably not from any data you actually have.
Bottom-up analysis is slower but much more grounded. Start with the number of businesses or individuals who genuinely fit your ideal customer profile. Multiply by realistic annual contract value or spend. The result is a TAM built from real units rather than inherited assumptions.
Run both. If they’re wildly different, that gap is telling you something important.
3. Ignoring the competition entirely
Your TAM should represent the total available spend on solving the problem you solve, including what customers currently pay competitors, in-house teams, or workarounds to address it.
Where founders go wrong is treating TAM as if it’s uncontested white space. It almost never is. The more honest question isn’t “how big is this market?” It’s “how much of this market is genuinely up for grabs, and over what timeframe?”
That’s your SOM doing the real work. But getting there requires an honest TAM as the starting point.

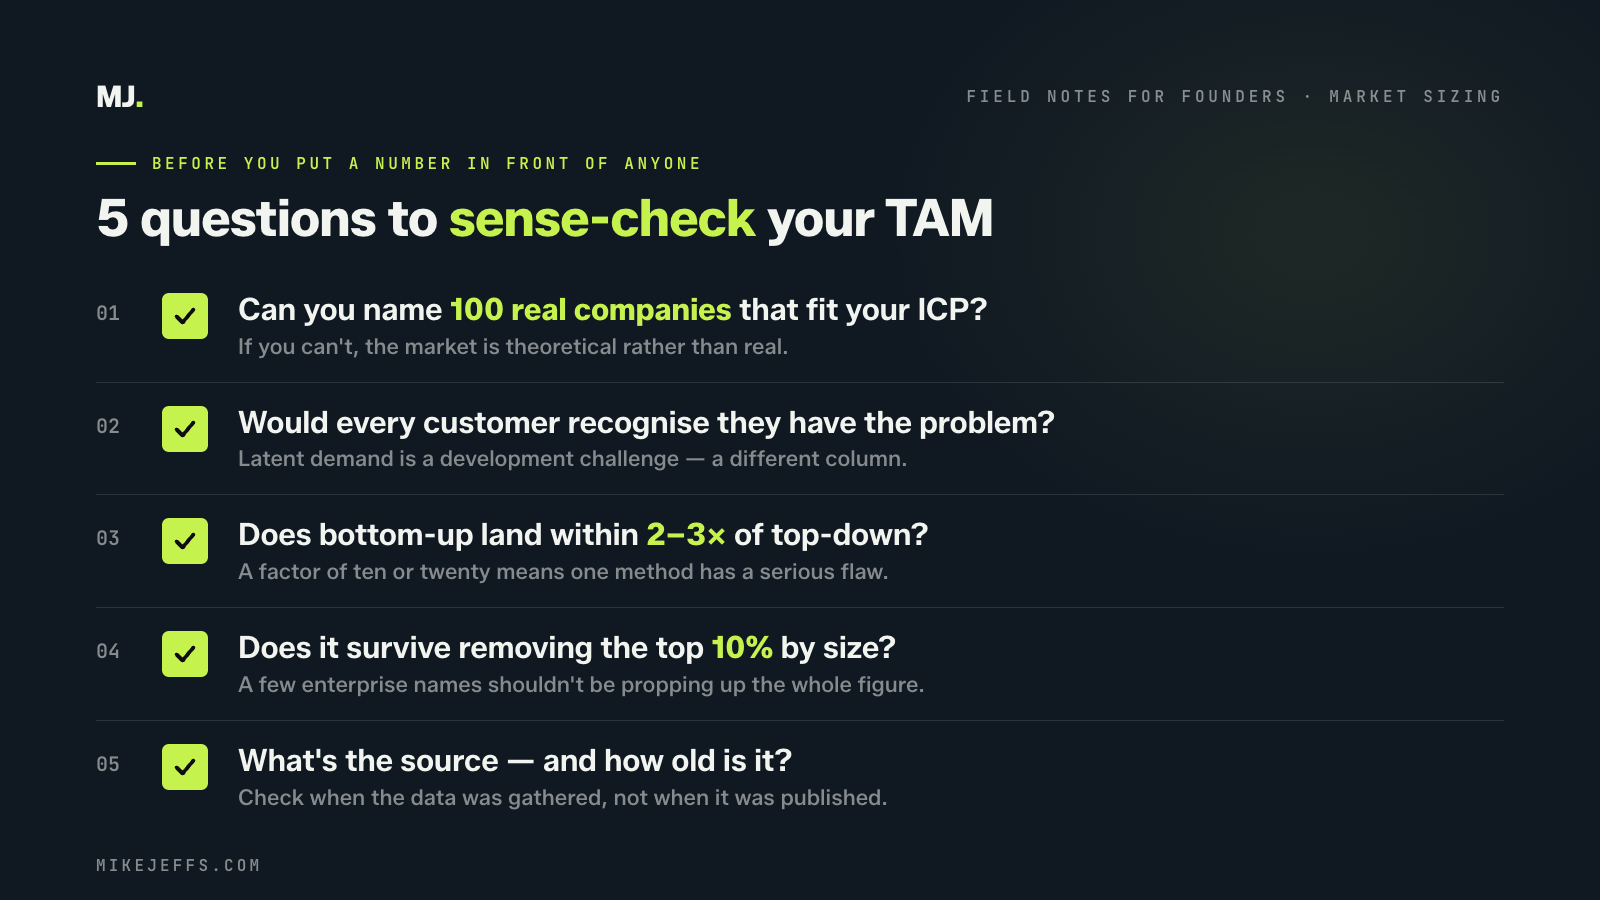
Five Questions to Sense-Check Your TAM
Before you put a market sizing figure in front of anyone (investor, board member, or potential hire), run it through these:
1. Can you name 100 real companies or individuals who fit your ICP within this TAM? If you can’t, your TAM is probably theoretical rather than real. A properly scoped market should be populated with actual, identifiable potential customers you could, in principle, name and reach.
2. Would every customer in your TAM recognise they have the problem you solve? TAM figures often include customers who have the problem in theory but don’t yet know it, or don’t prioritise solving it. That’s a market development challenge, not current addressable market. It’s worth knowing, but it belongs in a different column.
3. Does your bottom-up number get you to the same ballpark as your top-down number? A factor of two or three is explainable. A factor of ten or twenty suggests one of your methodologies has a serious flaw. Find it before someone else does.
4. What happens to your TAM if you remove the top 10% of customers by size? Enterprise customers often skew market sizing figures dramatically. If your number only holds up because a handful of very large organisations are in scope (and you’re not realistically selling to them yet) adjust accordingly.
5. What’s the source, and how old is it? Market research reports age quickly. A 2021 report published during the post-pandemic investment boom may paint a picture that looks nothing like the market you’re entering today. Check when the underlying data was gathered, not just when the report was published.
What a Credible TAM Actually Looks Like
A defensible market size calculation shows its working. It states clearly who is included and who isn’t, and why. It acknowledges the limits of the methodology and flags where assumptions have been made.
Here’s a simplified example of the difference:

Weak TAM: “The global marketing automation market is worth $6.4 billion. Our TAM is $6.4 billion.”
Credible TAM: “There are approximately 18,000 B2B SaaS companies in the UK with between 10 and 200 employees. Based on industry benchmarks, companies of this size spend an average of £8,000 to £14,000 annually on marketing automation tooling. Our addressable market is therefore in the range of £144m to £252m. We’ve used the midpoint of £190m as our working TAM, with the caveat that this excludes enterprise businesses above 200 employees, which we are not targeting in the next 24 months.”
The second version is smaller. It is also incomparably more credible, and it tells anyone reading it that you actually understand your market.
When Your TAM Is Smaller Than You’d Like
This happens more often than founders admit, and the instinct is usually to reach for a bigger industry figure to compensate. Resist it.
A smaller TAM with a credible path to meaningful share is a better business case than a large TAM with a vanishingly small SOM buried in the small print. Investors who back early-stage businesses know this. They’ve seen the other version too many times.
If your TAM is genuinely modest (say, under £50 million) that doesn’t automatically make the business unviable. It makes certain funding routes less appropriate and certain growth strategies less relevant. That’s useful information. It shapes your model rather than invalidating it.
The goal was never a big number on a slide. The goal was an accurate picture of the opportunity so you could build a strategy that actually captures it.
TAM and Your Marketing Strategy
There’s a practical reason to get this right that has nothing to do with investors.
Your TAM defines the ceiling of your marketing ambition. Your SAM defines where you should be spending now. If those numbers are wrong, your channel mix, your messaging, your ICP definition, and your content strategy are all built on a faulty foundation.
I’ve worked with businesses that were burning budget targeting a market segment that, once we properly scoped the TAM, turned out to be a tenth of the size they assumed. The pivot that followed was not comfortable, but it was necessary.
Know your market. Really know it. Not the headline figure from a research report — the real, bounded, evidenced picture of who is out there and what they’re spending and keep researching that market.
Everything else in your go-to-market strategy flows from that.